Insulin resistance does not begin with a diagnosis. It begins, quietly, with subtle changes in fasting insulin and hepatic glucose output. HOMA‑IR — calculated from a single morning glucose and insulin — captures that signal. For clinicians focused on prevention and patients invested in longevity, this low‑friction index can reveal metabolic drift years before hemoglobin A1c or fasting glucose cross diagnostic lines. Used thoughtfully, it is a practical lens on insulin biology in everyday care.
What HOMA‑IR measures — and what it does not
HOMA‑IR estimates whole‑body insulin resistance from fasting values. The original model relates fasting insulin to fasting glucose under a steady‑state assumption of hepatic glucose output and beta‑cell secretion (Matthews et al., Diabetologia, 1985). Practically, the calculation is simple: HOMA‑IR = (fasting insulin in µU/mL × fasting glucose in mg/dL) ÷ 405. Using SI units, HOMA‑IR = (fasting insulin in mU/L × fasting glucose in mmol/L) ÷ 22.5. The HOMA2 calculator refines this nonlinearly for modern assays (Wallace, Levy, and Matthews, Diabetes Care, 2004).
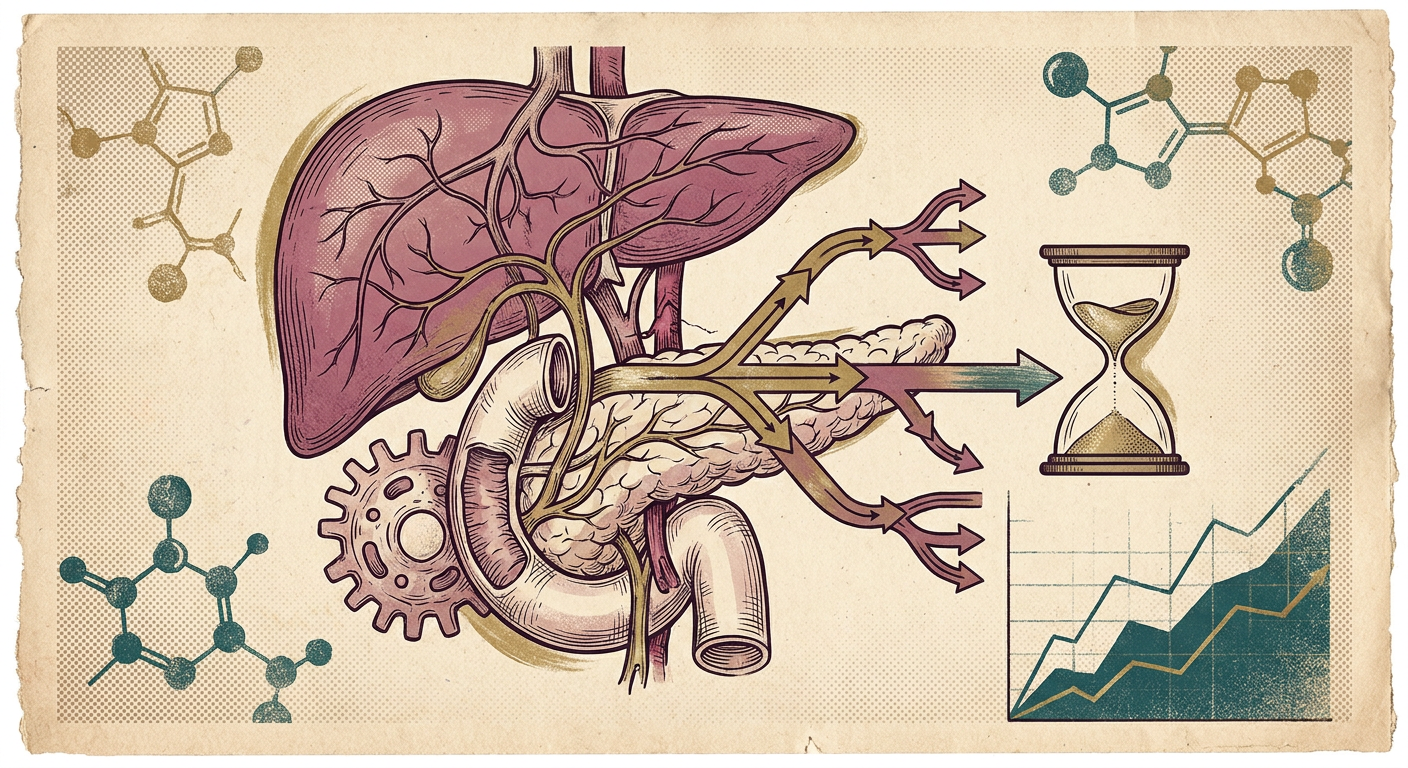
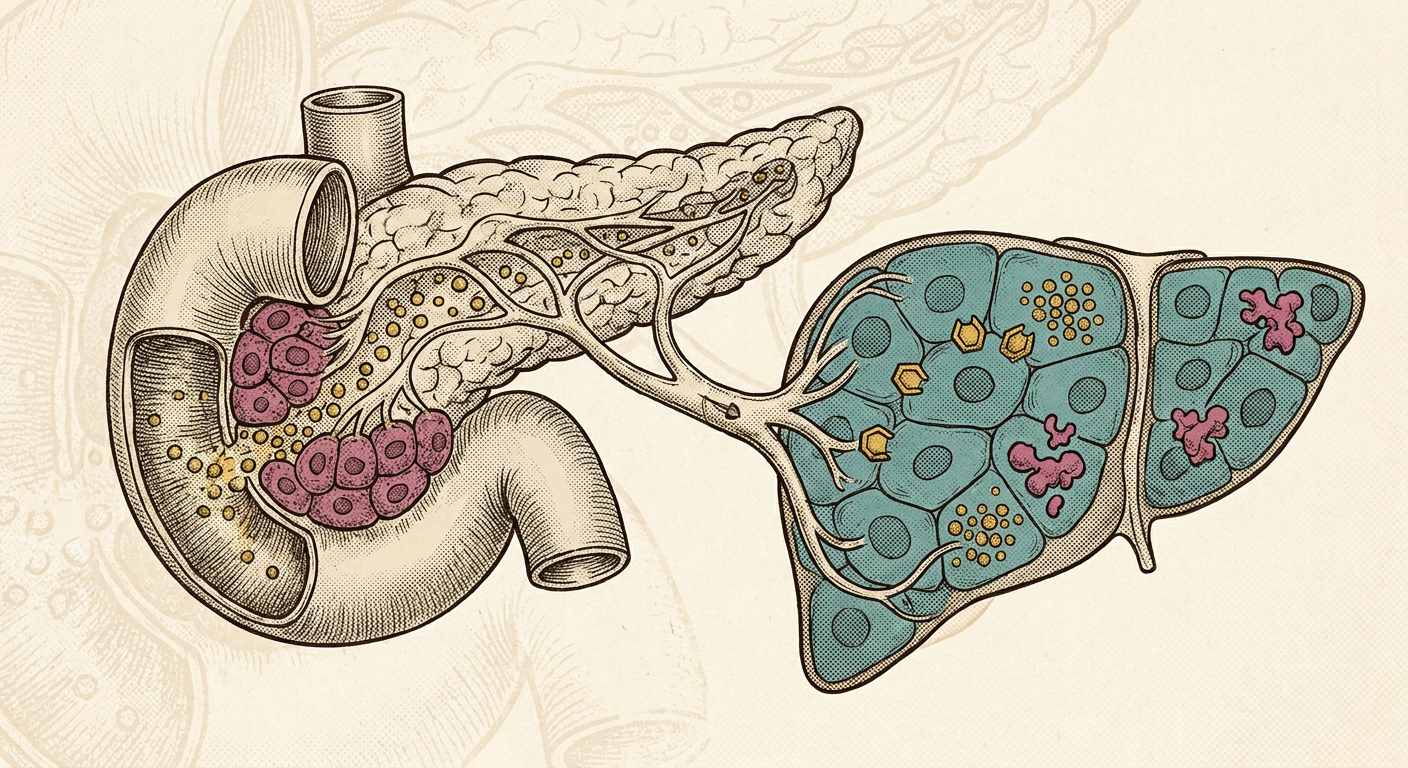
Physiologically, fasting measurements are dominated by hepatic insulin resistance. Overnight, the liver’s glucose output is restrained by insulin; when hepatocytes become insulin‑resistant, glucose production rises and the beta cell compensates with higher basal insulin. HOMA‑IR reads that compensation. It therefore aligns more with hepatic than skeletal muscle insulin sensitivity, and it is insensitive to post‑prandial dynamics that an oral glucose tolerance test (OGTT) or clamp can capture.
Two cautions follow. First, there is no universal diagnostic cutoff. Background insulin levels vary by age, adiposity, ethnicity, and assay. Second, HOMA‑IR is not validated in several contexts: pregnancy, type 1 diabetes, advanced beta‑cell failure, or in people using exogenous insulin. In these settings, interpretation can be misleading and should default to other modalities.
Validation against the clamp and other indices
No surrogate is perfect, but HOMA‑IR has been validated against the hyperinsulinemic–euglycemic clamp — the gold standard for insulin sensitivity. In a Diabetes Care validation study, HOMA metrics correlated strongly with clamp‑derived glucose disposal (Bonora et al., 2000). In the JCEM paper introducing QUICKI, HOMA‑IR also showed robust inverse correlation with clamp measures (Katz et al., 2000). Reviews consistently place typical correlations in the 0.6–0.8 range depending on phenotype and assay (Wallace et al., 2004; Muniyappa et al., Curr Opin Clin Nutr Metab Care, 2008).
Figure · bar
HOMA‑IR correlates with clamp‑measured insulin sensitivity
Across independent cohorts, HOMA‑based indices track gold‑standard insulin sensitivity with moderate‑to‑strong correlation.
Interpretation should respect the limits of any correlation. Muscle insulin resistance, meal‑time insulin dynamics, and hepatic lipid handling can all diverge from fasting patterns. That is why pairing HOMA‑IR with anthropometrics (waist circumference), fasting triglycerides and HDL‑C, and liver enzymes (as proxies for NAFLD) typically strengthens risk assessment.
Signals years before disease
Insulin resistance precedes frank dysglycemia. In the Whitehall II cohort, glycemic biomarkers drifted for years before diabetes diagnosis; HbA1c rose about three years pre‑diagnosis while fasting glucose changed earlier (Tabak et al., NEJM, 2009). Fasting insulin, and by extension HOMA‑IR, often moves first — reflecting compensatory hyperinsulinemia while plasma glucose still looks "normal."
Prospective cohorts in diverse populations support this sequence. In the San Antonio Heart Study, higher baseline HOMA‑IR predicted incident type 2 diabetes independent of adiposity and family history (Hanley, Williams, Stern, and Haffner, Diabetes, 2003; Diabetes Care, 2004). Among Pima Indians, elevated fasting insulin predicted diabetes years later even after accounting for insulin secretion capacity (Weyer et al., Diabetes, 2000–2001). In middle‑aged civil servants in the UK, higher HOMA‑IR associated with subsequent diabetes and with coronary outcomes, although effect sizes varied by sex and adiposity strata (analyses from the Whitehall II Study).
"Insulin resistance leaves biochemical footprints long before glucose fails."
— Dr. Ari Sahebkashaf
For longevity, lead‑time matters. Cardiometabolic risk accrues silently in the insulin‑resistant state: hepatic steatosis intensifies, triglyceride‑rich lipoproteins rise, and endothelial function declines. Small prospective studies suggest HOMA‑IR tracks nonalcoholic fatty liver disease progression and subclinical atherosclerosis, even when fasting glucose remains in the reference range (Bonora et al., Diabetes Care, 2002; Rundek et al., Stroke, 2002). Limited evidence suggests that individuals whose HOMA‑IR improves over time also improve surrogate vascular and hepatic endpoints, though randomized trials of "treating HOMA‑IR" per se are lacking.
Practical use: measuring, trending, and contextualizing
Measurement is simple. Obtain a morning fasting plasma glucose and fasting insulin after at least eight hours without caloric intake. Confirm units, compute HOMA‑IR with the appropriate formula, and — if possible — use the HOMA2 calculator when insulin is outside the linear range or C‑peptide is substituted (Wallace et al., 2004). Re‑measure in a stable physiologic window; acute illness, short‑sleep, recent strenuous exercise, or high‑carbohydrate evenings can transiently alter fasting insulin.
Interpretation is contextual. There is no universal cutoff, but many studies in European‑ancestry adults treat values roughly above 2–2.5 (HOMA1‑IR) as insulin‑resistant, while lean young adults often cluster near 1.0. Populations differ: East Asian cohorts tend to show clinically relevant insulin resistance at lower absolute HOMA‑IR, while in obesity‑prevalent cohorts the distribution shifts higher (Wallace et al., 2004; Hanley et al., 2003). Rather than fixate on a single threshold, track personal trajectories and pair with clinical features: waist circumference, blood pressure, triglyceride/HDL‑C ratio, ALT, and family history.
What should a clinician or patient do with a higher‑than‑expected HOMA‑IR but normal glucose? First, repeat the measurement under clean conditions to confirm. Second, audit contributors: weight trajectory, visceral adiposity, physical activity, sleep duration, alcohol, and medications that can raise insulin (e.g., corticosteroids, some antipsychotics). Third, consider expanding testing to clarify physiology: OGTT for post‑prandial control, lipid panel for atherogenic dyslipidemia, liver ultrasound or FIB‑4 if NAFLD is suspected.
Interventions are familiar but impactful. Weight reduction, resistance training, and higher cardiorespiratory fitness improve hepatic and peripheral insulin sensitivity in randomized trials. Dietary patterns that reduce hepatic fat — hypocaloric Mediterranean‑style diets, lower‑refined‑carbohydrate approaches, and time‑restricted eating — lower fasting insulin in many participants. Sleep extension and stress reduction have smaller but measurable effects. Pharmacotherapy is beyond the scope here, but in people with prediabetes or very high risk, metformin and newer incretin‑based agents improve insulin resistance and reduce incident diabetes in trials; these decisions are individualized and guideline‑driven.
Limits, caveats, and longevity framing
HOMA‑IR is not a diagnosis and not a crystal ball. It is one lens on insulin biology. Assay variability, biological day‑to‑day noise, and population differences argue for serial measurement and triangulation with other risk markers. The ADA Standards of Care do not recommend fasting insulin or HOMA‑IR to diagnose diabetes; diagnosis rests on glucose and HbA1c (Diabetes Care, 2024).
Yet for longevity, the value proposition is realistic: detect metabolic drift early, quantify it simply, and act before glucose derangements harden into disease. When tracked over years, a downward trend in HOMA‑IR — especially when accompanied by falling triglycerides, shrinking waist circumference, and improving fitness — likely reflects improved metabolic resilience. Observational analyses from population cohorts link lower HOMA‑IR with lower risk of future diabetes, fatty liver disease, and cardiovascular events, but causality remains unproven outside interventional contexts.
In short: treat HOMA‑IR as a sensitive barometer of hepatic insulin resistance, not as a standalone verdict. Its best use is longitudinal, contextual, and coupled to pragmatic prevention.
References & Further Reading
- 1. Matthews et al. (1985) Homeostasis model assessment: insulin resistance and beta-cell function from fasting plasma glucose and insulin concentrations in man. Diabetologia. https://doi.org/10.1007/BF00280883
- 2. Wallace et al. (2004) Use and Abuse of HOMA Modeling. Diabetes Care. https://doi.org/10.2337/diacare.27.6.1487
- 3. Bonora et al. (2000) Homeostasis model assessment closely mirrors the glucose clamp technique in the assessment of insulin sensitivity. Diabetes Care. https://doi.org/10.2337/diacare.23.1.57
- 4. Katz et al. (2000) Quantitative Insulin Sensitivity Check Index: A Simple, Accurate Method for Assessing Insulin Sensitivity in Humans. Journal of Clinical Endocrinology & Metabolism. https://pubmed.ncbi.nlm.nih.gov/10902785/
- 5. American Diabetes Association Professional Practice Committee (2024) 2. Classification and Diagnosis of Diabetes: Standards of Care in Diabetes—2024. Diabetes Care. https://doi.org/10.2337/dc24-S002
- 6. Browning et al. (2004) Hepatic triglyceride content and insulin resistance in lean and obese individuals. Hepatology. https://doi.org/10.1002/hep.20434
- 7. Knowler et al. (2002) Reduction in the incidence of type 2 diabetes with lifestyle intervention or metformin. New England Journal of Medicine. https://doi.org/10.1056/NEJMoa012512
- 8. Shai et al. (2008) Weight loss with a low-carbohydrate, Mediterranean, or low-fat diet. New England Journal of Medicine. https://doi.org/10.1056/NEJMoa0708681
- 9. le Roux et al. (2017) Three years of liraglutide versus placebo for type 2 diabetes risk reduction and weight management in individuals with prediabetes (SCALE Obesity and Prediabetes): a randomised, double-blind trial. The Lancet. https://doi.org/10.1016/S0140-6736(17)30069-7
- 10. Sutton et al. (2018) Early time-restricted feeding improves insulin sensitivity, blood pressure, and oxidative stress even without weight loss in men with prediabetes. Cell Metabolism. https://doi.org/10.1016/j.cmet.2018.04.010
— End of Article —


